Nike Tech Digital Transformation

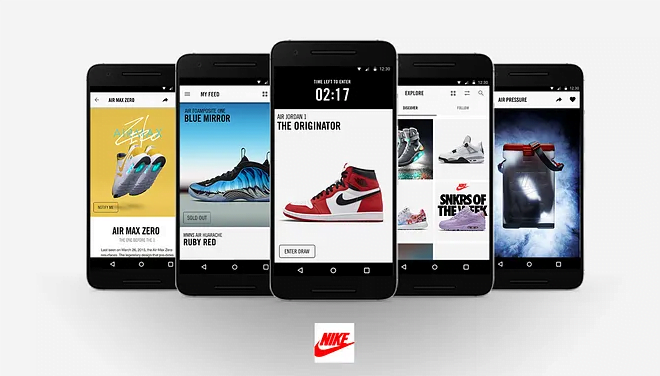
Nike is in the middle of one of the most significant digital transformations since it began doing business in 1972. The modern consumer wants products and content tailored to their individual needs. It is no longer sufficient to provide a curated set of offerings that are available to anyone; instead, we must create a personal experience, tailored for the specific ways our consumers engage with the brand. This can include things from offering early access to products to tailoring individual workout recommendations.
Offering these various experiences also requires a shift in the way Nike thinks about its digital platforms. Five years ago, almost all of the platforms were commercial, off-the-shelf products purchased from various vendors. Teams were responsible for integrating these products together to enable the various capabilities desired. Now, many of our capabilities are developed in-house, giving us increased speed-to-market and flexibility. This increased speed and homegrown approach has also meant rethinking what it takes to monitor these systems.
When my team started to build the next generation of Nike services, we needed to determine what to monitor and what platforms best met our needs for monitoring. The set of monitoring systems we use spans the three pillars of observability: metrics, traces and logs. (Cindy Sridharan has an excellent primer on this topic titled Logs and Metrics).
One of the main reasons to build this new set of services is to continue to support shoe drops. Our architecture needs to handle thousands of individual service instances appearing and disappearing in minutes, and our monitoring tools need to support this. Over time, we have learned that tools like Splunk are great for post-incident analysis, but with their current capabilities, they cannot tell us what is happening in real time. We needed a metrics platform that would allow for faster aggregation of the information, so we could see the activity much closer to real time.
Measure What Matters
In the summer of 2017, Nike started to use the platform that was originally developed for high-demand launches for its everyday online sales. This delivered on a promise that a single set of services developed for the cloud can be used for multiple experiences. As the team implemented several key features and headed into the holiday season, we needed to know that the services were working. Nike chose to implement a distributed microservices architecture, mainly for scaling and recovery concerns. But one of the challenges we faced with this architecture was how to monitor it.
We went through several standard monitoring frameworks before determining that custom metrics were needed to truly monitor the key performance indicators (KPIs). One of the key challenges in our search for the right metrics platform was finding one that could ingest large amounts of data quickly. This is because, during these launch events, we emit metrics at an extremely high rate. We evaluated several vendors before determining that SignalFx best fit our needs. The first version of these custom dashboards was implemented in late in 2017. They brought an immediate measure of confidence to the teams responsible for the services; if something was wrong, folks would know about it quickly.
The Checkout Business Metrics dashboard was the first dashboard we created. It immediately brought to our team a level of confidence in our ability to determine whether or not our platform was selling product without interruption. After using this dashboard for a while, we realized that it didn’t go far enough as a monitoring tool. While it significantly boosts visibility into our service, it does not determine if consumers are having issues while purchasing product on our site. For example, our inventory service returns a 4xx error when an item is out of stock. We always expect some level of 4xx errors to be happening, but there is cause for concern if that error rate becomes too high or too low. While we still use this dashboard, we evolved the concept with subsequent tools in order to provide clearer visibility into consumer errors.
During the holiday season last year, we had a couple of big public failures which could be attributed to just a few services. While the image above shows only a small portion of the entire dashboard, it is easy to determine the health of the service at a glance. You can see the number of requests from the internet as well as how many requests have been received by the service. The team responsible for this service has also exposed the latency of the services downstream, so they can quickly tell where a spike in latency originates.
The Checkout Business Metrics and Shipping Options dashboards represent different concerns to Nike. The first shows many consumer-level KPIs, number of checkouts, average duration of checkout, etc. The second dashboard shows platform-level KPIs, including the number of requests and latency. With custom metrics, we can also enable a third type of KPI dashboard. This is strictly a business-level KPI dashboard and is used during key events to show our business partners what the platform is capable of.
Infrastructure As Code
One of the biggest challenges faced by Nike was that, once teams started to implement custom metrics, three different patterns emerged. One pattern was a team that wholly embraced custom metrics and took ownership of the metrics for themselves. Another pattern involved teams that didn’t see value in the metrics and didn’t prioritize the work to implement them. The third pattern was a team that saw the value, but lacked the skills or time necessary to implement them. For the latter two patterns, one of our teams worked closely with our metrics provider to develop signal_analog.
signal_analog enables teams to define, version and deploy monitoring resources. Additionally, it gives us a standardized library for common metrics, so every team that reports latency does so using the same naming conventions. This feature greatly simplifies things for our Core SRE team. We use this in conjunction with wingtips, which gives us distributed tracing based on the Google Dapper paper. The combination of these two tools means that teams that were reluctant or unable to implement monitoring now have a straightforward path with a low bar for implementing metrics for their services.
These two internally-developed, open source libraries (signal_analog and wingtips) offer the ability for any team to get up to speed quickly with tracing and metrics. They also offer a standardized dashboard to ensure consistency of reporting across teams and organizations.
Conclusion
Nike quickly realized that monitoring CPU load, free memory and other traditional infrastructure metrics did not answer the questions we ask ourselves, like, “Are our services contributing to a good experience for the consumer?” and “Are we continuing to sell product, or has there been an interruption?” Teams at Nike have now implemented custom metrics across many hundreds of microservices, including those using serverless architecture. This has allowed monitoring of customer, business and platform KPIs. Two years ago, it took teams almost 20 minutes to determine the source of an incident during times of high site traffic. Now, teams can see these problems within seconds and immediately begin to triage the errors. Enabling custom metrics has also given us the confidence to release code faster. The State of DevOps Report shows that high-performing organizations move faster and build more resilient systems. After analyzing our own internal data about release frequency, we estimate that teams at Nike that utilize SignalFx release five to eight times faster than teams that do not.
Want to join the Nike Digital Team? Check out the available jobs here.


